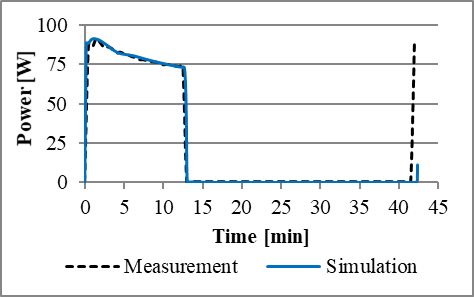
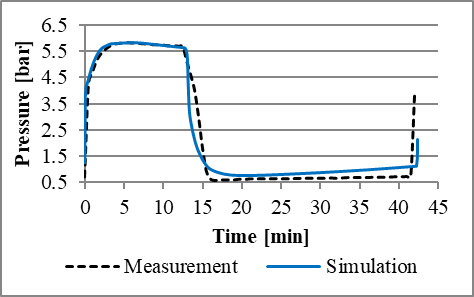

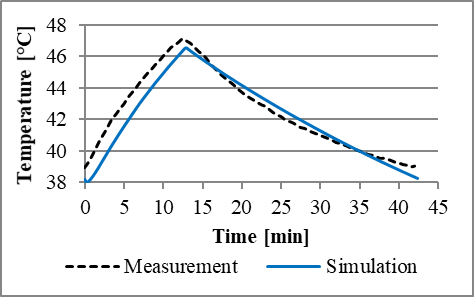
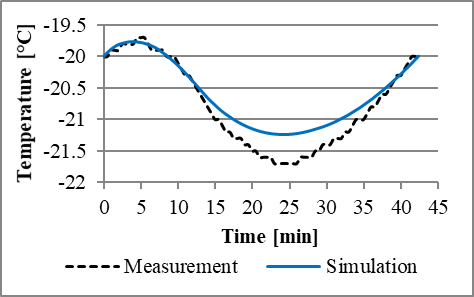
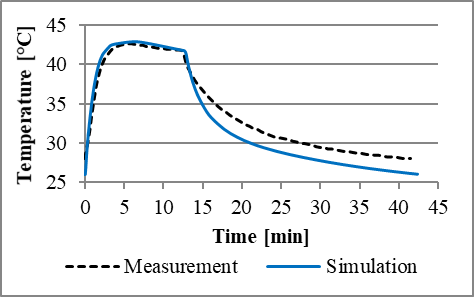
Transient simulation results compared to measurement data can be seen in in figure 2. The simulation result of the electric power consumption of the compressor (a) agrees very well with the measured values. Similarly, the duration of the on- and off-cycle could be mapped very well. During operation of the compressor, the discharge pressure correspondence is very good (b). The suction pressure shows a similar trend but the simulation results are around 0.05 bar higher than the measurements (c). When the compressor is switched off, the suction and discharge pressures are aligning, which can be seen in the measurement data. In the simulation, the compressor speed during an off-cycle was set to a small value as due to numerical reasons, the mass flow in the simulation cannot be set to zero. Therefore, there is no complete pressure alignment between evaporator and condenser. The pipe temperature of the condenser also deviates during the off-cycle (f). One of the reasons is the temperature dependence of the natural convection, which was not considered in the model so far. The measured temperature of the sensor decreases after switching off the compressor (e) which is less intensive in the simulation. However, within the threshold (-20 °C and -20.5 °C), which is important for the simulation, the measurement and simulation are in good agreement.

ECO-SIMULATION

Development of energy-efficient refrigeration cycle systems applying a novel simulation methodology
Projectduration: February 2018 – January 2020
Projectfunding: Klima- und Energiefond
Projectleader: Liebherr-Hausgeräte Lienz GmbH
Projectpartners: SimTech Graz, TU Graz: IVT
Project Team IVT: Bernhard Zuber, Raimund Almbauer
The development of refrigeration appliances is mainly experimentally driven. To evaluate improvements on the system of newly developed or optimized components of cooling and refrigeration appliances, the components have to be integrated into the real world system and measured in climatic chambers or test benches. This iterative process leads to high development costs and furthermore, energy saving potentials cannot be recognized and exploited. The use of simulation tools enables a holistic dynamic simulation of the refrigeration circuit components and their complex interaction within the entire system taking into account the relevant boundary conditions. For manufacturers of domestic refrigeration appliances two main advantages arise:
- Time savings and cost reduction in the development process of cooling and refrigeration appliances
- Increase of the energy efficiency
These aspects yield in remarkable advantages for manufacturers of domestic refrigeration appliances on the global market. Commercial software to simulate the transient behavior of a cooling circuit in the required quality is not available on the market. In the course of the project considerable challenges and risks occur. Especially the accurate modeling of the physical behavior, the consideration of 3d effects in the development of the model library, the modeling of the sensors and the transient simulation of the cooling circuit are not state-of-the-art.
Part of the research work deals with the determination of model parameter values ââin order to be able to map the measurement data as well as possible.
Parameter calibration
For parameter tuning, a semi-automatic model calibration method has been developed. Due to interactions and non-linear dependencies between the model parameters, manual parameter optimization would be very time consuming and inefficient. The semi-automatic calibration method can process a large parameter set quickly and easily.
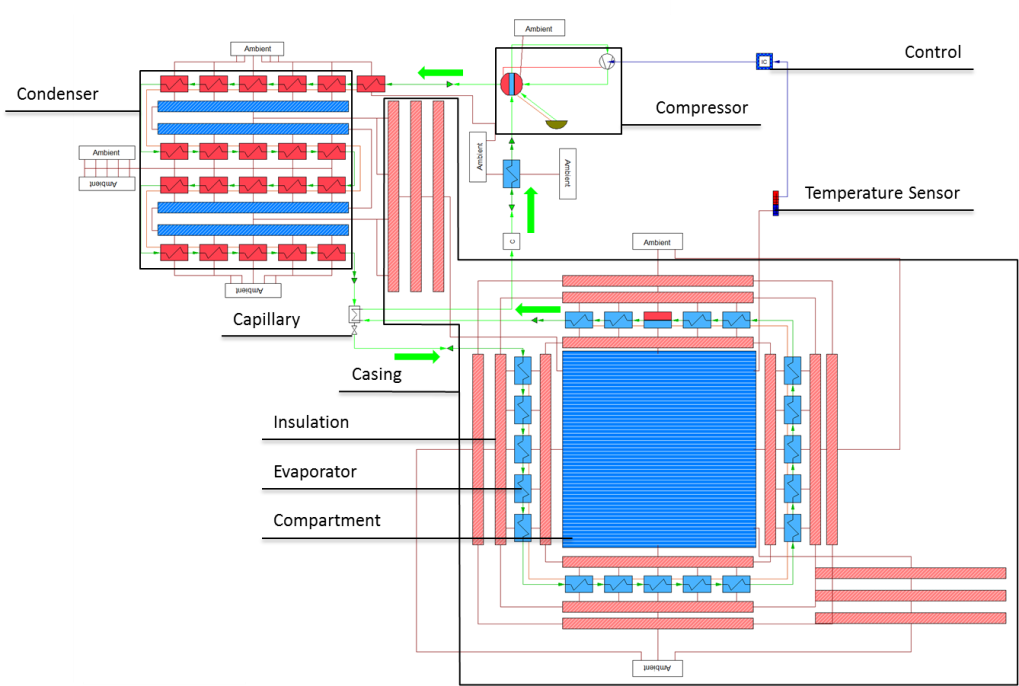 |
| Fig. 1: Flow sheet model of the household freezer in the modelling software |
Fifteen measured quantities which were obtained in steady-state and transient tests are used to calibrate the simulation model. In addition to the pipe temperatures along the refrigerant circuit, the high and low pressure at the compressor, the compressor capacity, the ambient temperature and the sensor temperature in the interior were measured. In order to calibrate the simulation model, suitable model parameters (e.g. parameters with high uncertainty) must be selected. In this case, the heat transfer coefficients on the surfaces are associated with high uncertainties as they cannot be fully mapped in the abstracted 0d / 1d model. Ten parameters were selected for calibration. The parameters are divided into two main groups. Seven parameters are determined in the first step of the automatic calibration for steady-state results. Parameters include heat transfer rates and calibration factors for the pipe pressure losses. The remaining three parameters have no influence on the results of the steady-state simulation. They are used to calibrate the transient simulation. For example the thermal inertia of the temperature sensor influences the transient behaviour of the system significantly as it is related to the running time of the compressor.
|
|
|
|
(a) Compressor electric power |
(b) Pressure at compressor outlet |
|
|
|
|
|
|
|
(c) Pressure at compressor inlet |
(d) Surface temperature of compressor |
|
|
|
|
|
 |
|
(e) Sensor temperature |
(f) Condenser pipe temperature after 50% length |
|
Fig. 2: Comparison of simulation and measurement results |
|
